Google Ads management
Search · Shopping · Performance MaxSearch, Shopping and Performance Max built around buyer intent and product margin, scaled only where the return holds.

By truly understanding your business, we build paid search and social from the bottom of the funnel up: your margins, average order value, breakeven return, which customers are actually worth acquiring. Profitable by design, not by accident.
One high-AOV Shopify brand, five months. $1,407,228.92 in total sales from January to May 2026, with $852,936 of it from Google paid search.
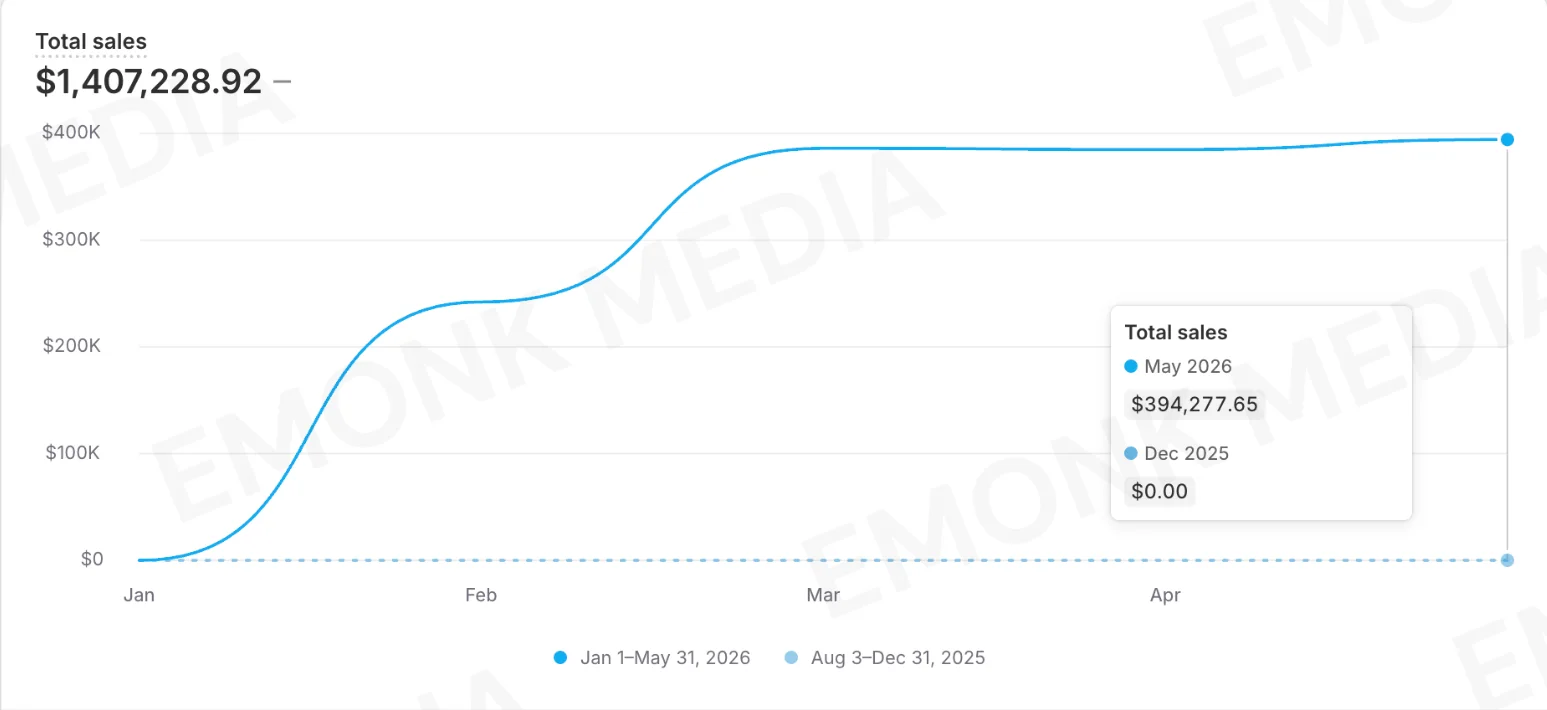
The account was stuck near $70k a month with no real structure. Before anything else, conversion value tracking was repaired, so the platform was bidding on real revenue rather than what it happened to be counting.
Shopping and Search rebuilt around product margin and buyer intent, with targets set on breakeven ROAS. Profitable meant profitable to the brand, not to a dashboard.
Budget went only into the segments holding return. Weekly spend rose from $4,196 to $16,024 while ROAS rose from 4.17× to 5.09×. That is the same sequence we run on every account.
Google Ads and Meta Ads management, with the tracking, feeds and reporting that make them work. Built for ecommerce, applied just as carefully to SaaS and service businesses.
Search, Shopping and Performance Max built around buyer intent and product margin, scaled only where the return holds.
Structure, creative testing and audience strategy. Budget scaled against a target return, not against reach.
GA4 and conversion tracking that bid to the right number. Merchant Center feeds grouped by margin. Pixel and Conversions API set up so events are reliable.
Targets set on profit and breakeven ROAS. A monthly report in plain English: what changed, what it did, what’s next.
Most accounts we take on are structured around what looks tidy rather than what makes money. We rebuild around intent and margin, repair the tracking, and only then scale budget into the segments that keep earning it.
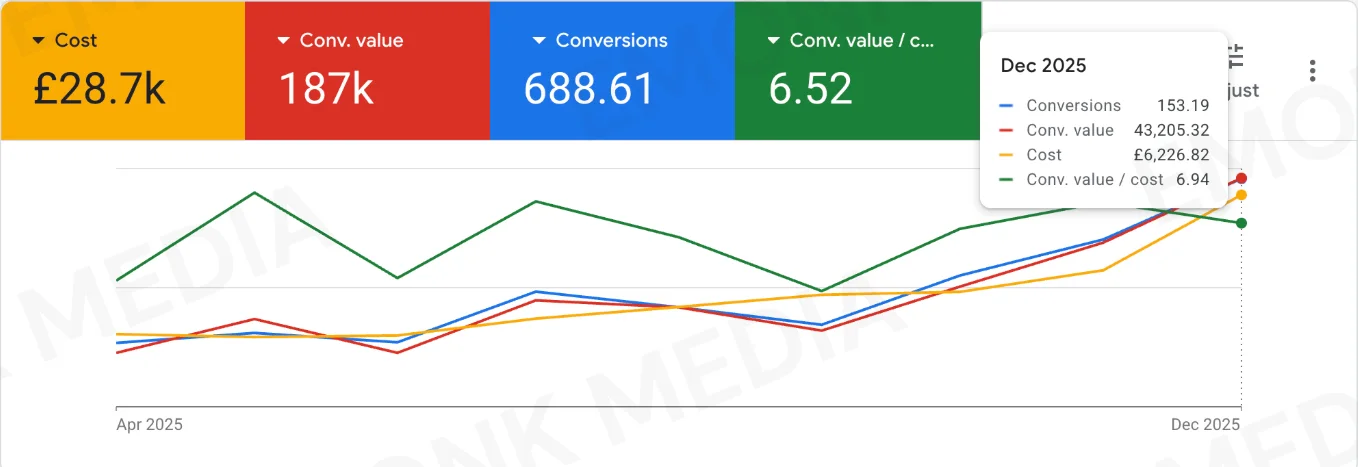
$6,800 to $56,800 a month in nine months, with ROAS rising from 4.76× to 6.94×. Campaigns rebuilt around buyer intent, feed grouped by contribution margin, budget scaled strictly where the return held.
Fashion & apparel · Google Ads · Apr–Dec 2025Meta accounts live or die on two things: whether the events are real, and whether the creative makes the point without making the viewer think. We fix the first, test the second, and scale against a return target rather than reach.

66 leads in 30 days at $5.25 a lead, on a $20 daily budget. Audience research and creative that made the point without making the viewer think.
Loan brokerage · Meta Ads · Ads Manager, Dec 2025 – Jan 2026No two accounts are the same, but the sequence is. Five steps, none of them clever.
Discovery. A 30-minute call on how you sell today and where paid fits in. Nothing to prepare.
Numbers. Your margins and breakeven ROAS, so we know what a return needs to look like to be worth it.
Build. Tracking fixed first. Then structure, feeds and audiences rebuilt around intent and margin.
Optimise. Creative, audiences and bids tested against the target. Losers switched off.
Scale. Budget up only where the return holds. A report every month.
No testimonials, no client names. Just the numbers, labelled by sector, from accounts we run.
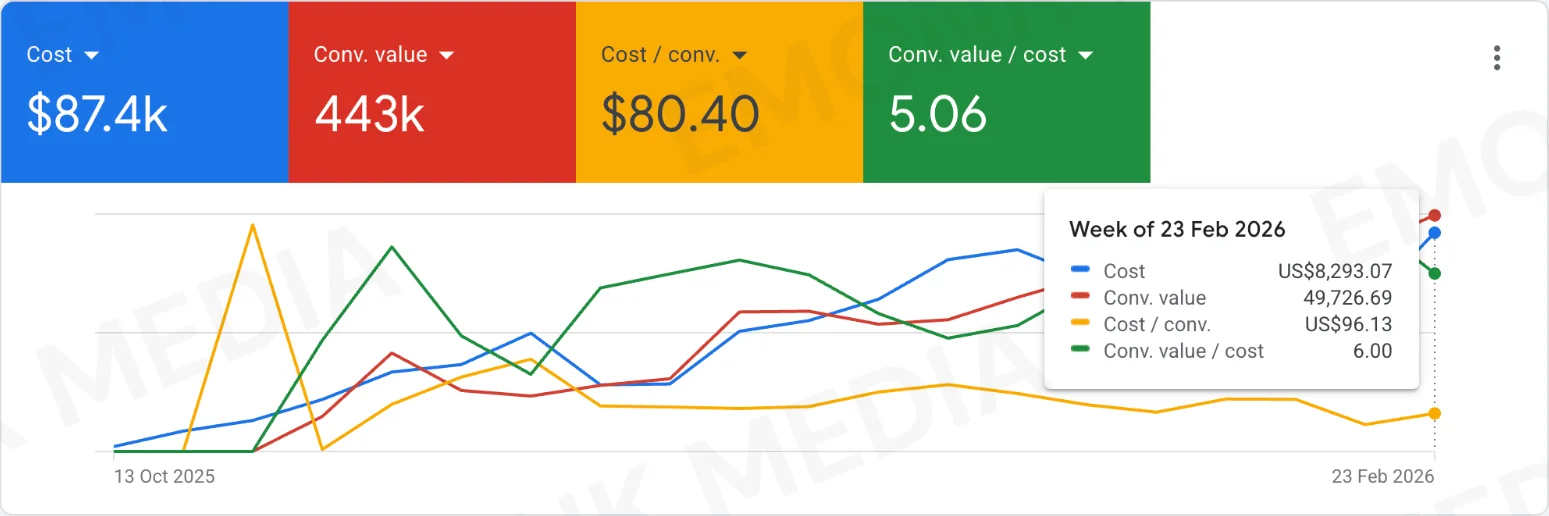 6×
6×
ROAS, up from 3.9×, while weekly spend more than doubled over 19 weeks.
Home goods & decor · Google Ads
66 leads
in 30 days at $5.25 a lead, on a $20 daily budget.
Loan brokerage · Meta
8.4×
monthly revenue in nine months, while the return improved at the same time.
Fashion & apparel · Google Ads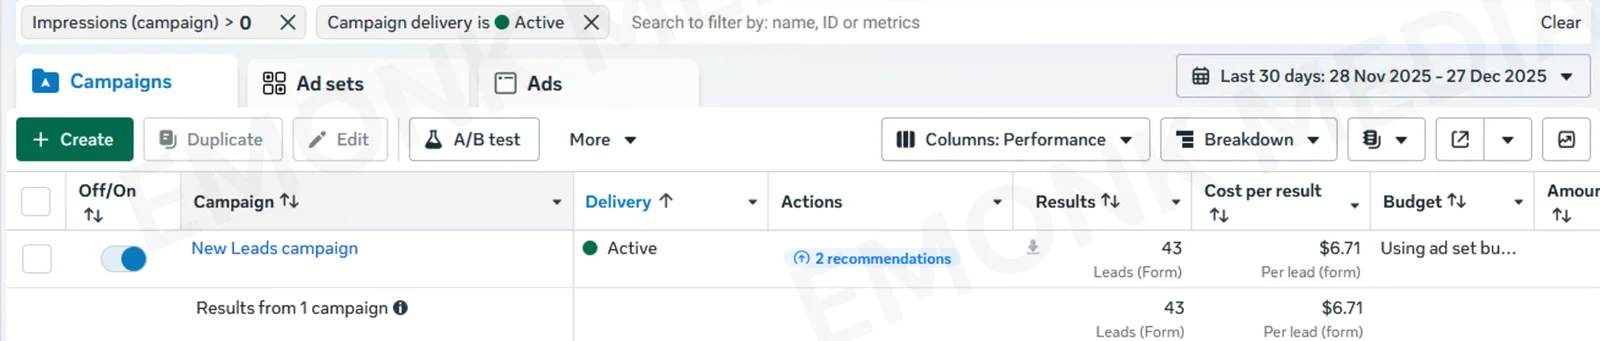 43 leads
in a month at $6.71 a lead, against a target of four.
Local service · Meta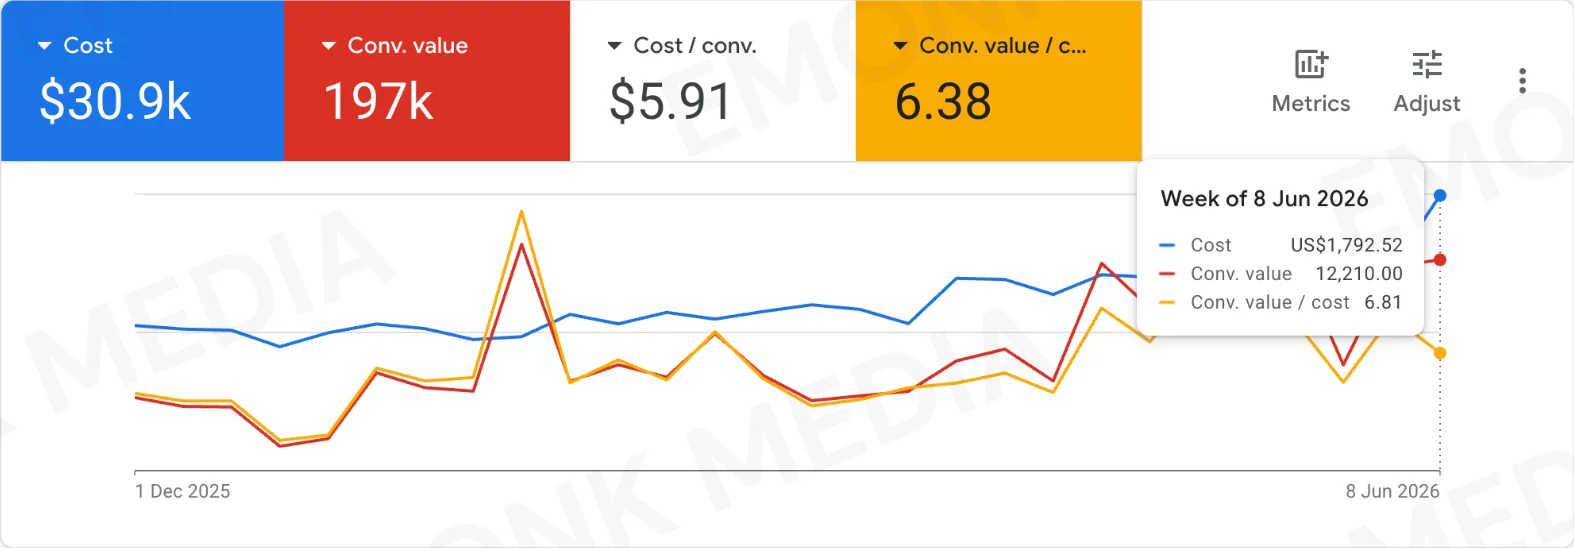 6.81×
6.81×
ROAS, up from 4.03×, while doubling spend over 27 weeks.
B2C SaaS · Google Ads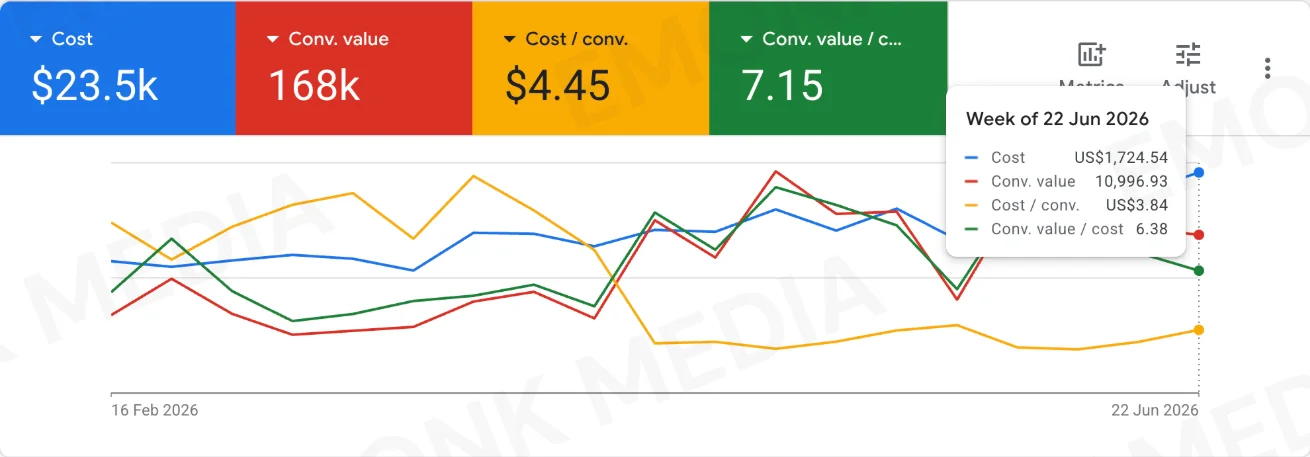 −63%
−63%
cost per acquisition, with return rising alongside it.
B2B SaaS · Google AdsReal accounts. Names withheld under client agreement. Different brands see different results.